MRP in SAP Business One: A Business Scenario.
Introduction
MRP – Material Requirement Planning in SAP Business One creates recommendation for purchase orders and production orders based on some inputs such as Purchase Orders, Sales Orders, Inventory Status, Forecast, Bill of Material, Lead time, Minimum Order quantity, Parent dependent requirement, Parent Production Order, etc.
Essentially, MRP works like an expert system, which determines how much would be purchased for a purchase item and produced for a manufactured item at a particular point in time.
It can be said that it is an intelligent system!
In this posting, I will concisely explain the SAP Business One MRP Run, Result and Recommendation. This I intend to achieve by using a simple business scenario detailed below. A number of screen shots are provided to better analyze the concept.
Business scenario
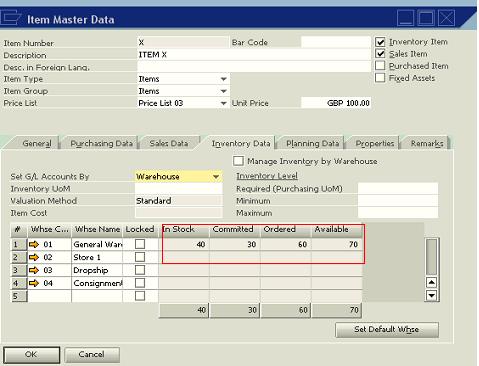
Company ABC produces and sells item X. Item X is a produced (make) not a purchased (buy) item and it is managed by MRP. It is assumed that the components needed to produce Item X is in stock. It has a lead time of 6 days and a minimum order quantity of 10. As at today, the inventory status of item X is shown below.
1. 40 quantities of item X are in stock.
2. 60 quantities of item X are ordered as a result of a production order raised with due date in one month from today.
3. 30 quantities of item X are committed as a result of a sales order received with delivery date in two months from today.
4. 70 quantities of item X are available. This can be calculated from this formulae:
Available = in stock – committed + ordered
= 40 – 30 + 60 = 70
(see Figure 1 and Figure 2)
Figure 1
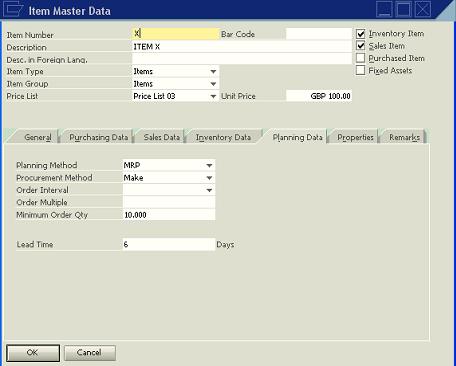
Figure 2
The planner knows from his prior knowledge of how the demand for item X flows, hence, he forecasts that, there will be a demand for 100 and 8 quantities of item X in the next 4 months and 6 months respectively. He also wants to plan for the next 8 months starting from today at an interval of 2 days. Furthermore, the MRP run for item X is designed to consume the forecast, existing stock, production orders and sales orders.
Forecast Definition
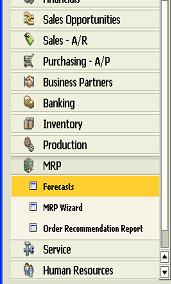
The forecast for the business scenario can be defined by accessing the path below.
MRP > Forecasts (See Figure 3)
Figure 3
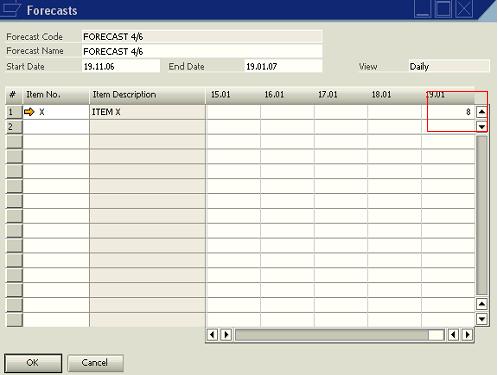
Enter FORECAST 4/6 in the Forecast Code
Enter FORECAST 4/6 in the Forecast Name
Start Date: Today’s date + 4 months
End Date: Today’s date + 6 months
Item No: X
Today’s date + 4 months: 100 (See Figure 4)
Today’s date + 6 months: 8 (See Figure 5)
Figure 4
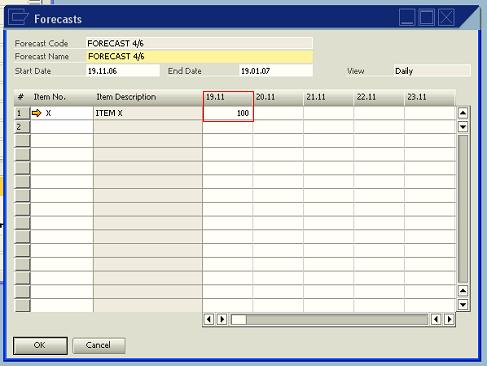
Figure 5
The MRP Run
The MRP wizard in SAP Business One has 5 major windows.
The following figures show the windows and information required or transactions performed on each window.
The functionality can be accessed under
MRP > MRP Run
Figure 6
Click Next in Figure 6 above, Figure 7 displays
Figure 7
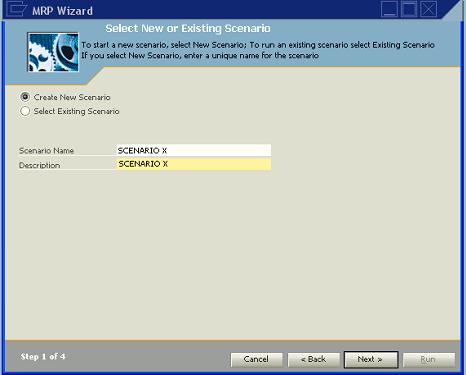
Enter values for the Scenario Name and Description
Scenario Name: SCENARIO X
Description: SCENARIO X
Then click Next. Figure 8 displays
Figure 8
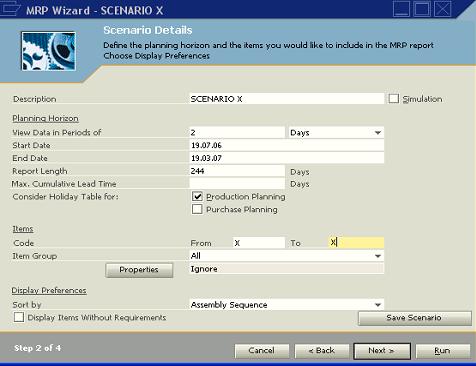
Enter values for the scenario details
View Data in Periods of: 2 Days
Start Date: Today’s date
End Date: Today’s date + 8 months
Item Code From: X
Item Code To: X
Choose Save Scenario
Choose Next, Figure 9 displays
Figure 9
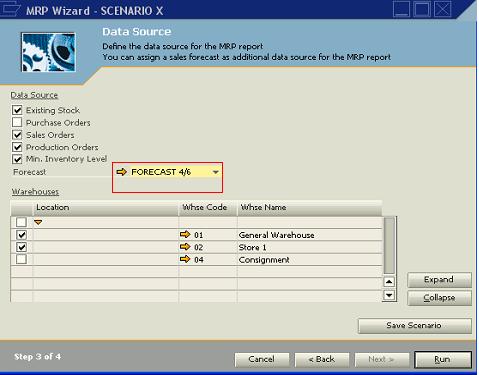
Enter values for the data source
Select Existing Stock
Select Sales Orders
Select Production Orders
Select Min. Inventory Level
Forecast: FORECAST 4/6
Select the Warehouses
Click Run, Figure 10 displays. This is the MRP Result screen
Figure 10
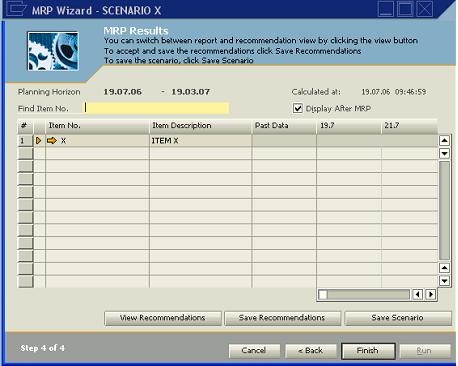
MRP Result
Typically, MRP result is made up of four major parameters: Initial stock (for the period), Receipt (for the period), Gross requirement (for the period) and Final stock (net requirement for the period).
Using our business scenario, two due dates are worthy of note as it relates to the MRP result.
1. 18.8.06 (After one month)
2. 19.9.06 (After two months).
See Figure 11 below.
Figure 11
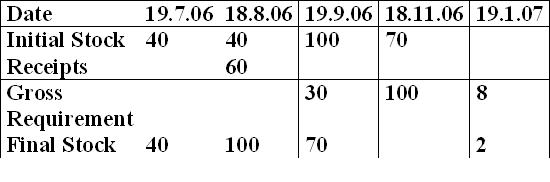
As at (1) above, there’s an initial stock of 40 (from today’s stock), a receipt of 60 and the final stock is 100.
As at (2) above, initial stock is 100 (a summation of today’s stock of 40 and receipt of 60 from the purchase order). Gross requirement is 30, from the sales order. The final stock therefore is 70, which is initial stock – gross requirement.
The MRP Recommendation report
As earlier stated, MRP creates recommendation for purchase order and production order depending on whether the item in question is a purchase item or production item. Item X in our business scenario is a produced item, hence the order recommendation report for the business scenario will contain two lines of production orders as shown in Figure 12 and 13 below.
Figure 12
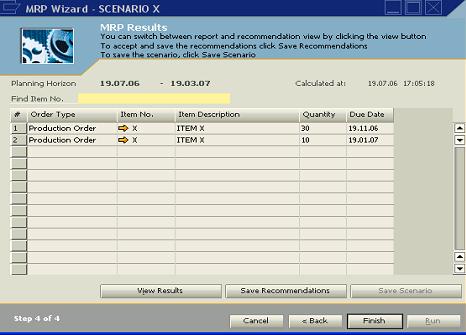
Figure 13 - Order Recommendation Report
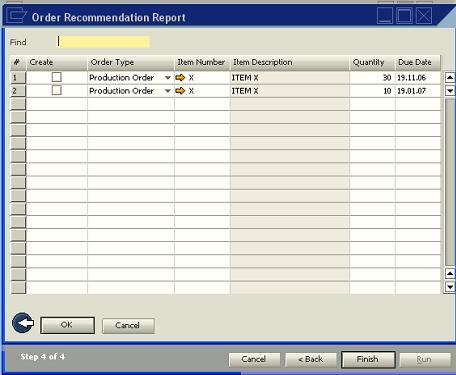
The first line will be a recommendation for 30 quantities of item X while the second line will be for 10 quantities of item.
Reason
Line 1. Remember that we have 70 in stock for the gross requirement from the first forecast quantity (next 4 months) of 100.
Line 2. Remember that we designed a gross requirement of 8 quantities of item X from the second forecast (next 6 months). However, item X has a minimum order quantity of 10. Take note that the due dates picked by the system is calculated from the dates defined for the forecast.
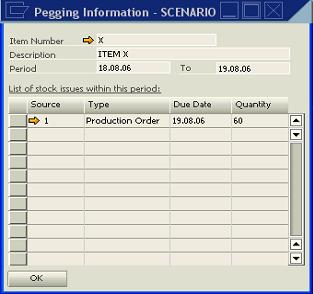
The pegging Information
The pegging information in SAP Business One can be analyzed by checking the quantity displayed in either the receipt row or the gross requirement row of the MRP result window.
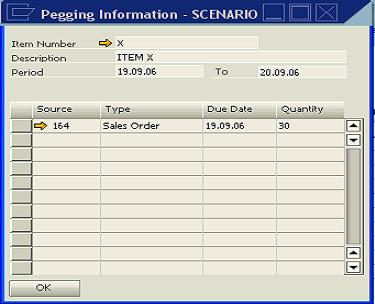
When the quantity for the receipt row is clicked, the source of the receipt is displayed. The source can be a purchase order or/and production order. The pegging information for gross requirement displays the source of the requirement, which can be open purchase orders, sales orders or forecasts.
The pegging information for the MRP result of our business scenario are shown in the figures below
Pegging information for receipt of 60 – 18.8.06 (see Figure 12) Note: I chose 2 Days interval
Figure 12
Pegging information for gross requirement of 30 – 19.9.06. (see Figure 13)
Figure 13
Colour Attributes
The MRP result has some “graphics sense”. Pale gray cells depicts periods where due date can not be met as a result of long lead-time. The values in these cells are displayed in red. Yellow cells depict periods in which receipt or gross requirement takes place.
Conclusion
Conclusively, there’s more to just running an MRP system. Been able to critically and objectively analyze the MRP is key to the success of an MRP system, especially when it is dependent on the ERP system – SAP Business One. This is because; the flaws in some definitions like lead-time, due date and even forecast, can impair on other modules like inventory, which can rubbish, not only the MRP system but also the ERP system.
MRP – Material Requirement Planning in SAP Business One creates recommendation for purchase orders and production orders based on some inputs such as Purchase Orders, Sales Orders, Inventory Status, Forecast, Bill of Material, Lead time, Minimum Order quantity, Parent dependent requirement, Parent Production Order, etc.
Essentially, MRP works like an expert system, which determines how much would be purchased for a purchase item and produced for a manufactured item at a particular point in time.
It can be said that it is an intelligent system!
In this posting, I will concisely explain the SAP Business One MRP Run, Result and Recommendation. This I intend to achieve by using a simple business scenario detailed below. A number of screen shots are provided to better analyze the concept.
Business scenario
Company ABC produces and sells item X. Item X is a produced (make) not a purchased (buy) item and it is managed by MRP. It is assumed that the components needed to produce Item X is in stock. It has a lead time of 6 days and a minimum order quantity of 10. As at today, the inventory status of item X is shown below.
1. 40 quantities of item X are in stock.
2. 60 quantities of item X are ordered as a result of a production order raised with due date in one month from today.
3. 30 quantities of item X are committed as a result of a sales order received with delivery date in two months from today.
4. 70 quantities of item X are available. This can be calculated from this formulae:
Available = in stock – committed + ordered
= 40 – 30 + 60 = 70
(see Figure 1 and Figure 2)
Figure 1
Figure 2
The planner knows from his prior knowledge of how the demand for item X flows, hence, he forecasts that, there will be a demand for 100 and 8 quantities of item X in the next 4 months and 6 months respectively. He also wants to plan for the next 8 months starting from today at an interval of 2 days. Furthermore, the MRP run for item X is designed to consume the forecast, existing stock, production orders and sales orders.
Forecast Definition
The forecast for the business scenario can be defined by accessing the path below.
MRP > Forecasts (See Figure 3)
Figure 3
Enter FORECAST 4/6 in the Forecast Code
Enter FORECAST 4/6 in the Forecast Name
Start Date: Today’s date + 4 months
End Date: Today’s date + 6 months
Item No: X
Today’s date + 4 months: 100 (See Figure 4)
Today’s date + 6 months: 8 (See Figure 5)
Figure 4
Figure 5
The MRP Run
The MRP wizard in SAP Business One has 5 major windows.
The following figures show the windows and information required or transactions performed on each window.
The functionality can be accessed under
MRP > MRP Run
Figure 6
Click Next in Figure 6 above, Figure 7 displays
Figure 7
Enter values for the Scenario Name and Description
Scenario Name: SCENARIO X
Description: SCENARIO X
Then click Next. Figure 8 displays
Figure 8
Enter values for the scenario details
View Data in Periods of: 2 Days
Start Date: Today’s date
End Date: Today’s date + 8 months
Item Code From: X
Item Code To: X
Choose Save Scenario
Choose Next, Figure 9 displays
Figure 9
Enter values for the data source
Select Existing Stock
Select Sales Orders
Select Production Orders
Select Min. Inventory Level
Forecast: FORECAST 4/6
Select the Warehouses
Click Run, Figure 10 displays. This is the MRP Result screen
Figure 10
MRP Result
Typically, MRP result is made up of four major parameters: Initial stock (for the period), Receipt (for the period), Gross requirement (for the period) and Final stock (net requirement for the period).
Using our business scenario, two due dates are worthy of note as it relates to the MRP result.
1. 18.8.06 (After one month)
2. 19.9.06 (After two months).
See Figure 11 below.
Figure 11
As at (1) above, there’s an initial stock of 40 (from today’s stock), a receipt of 60 and the final stock is 100.
As at (2) above, initial stock is 100 (a summation of today’s stock of 40 and receipt of 60 from the purchase order). Gross requirement is 30, from the sales order. The final stock therefore is 70, which is initial stock – gross requirement.
The MRP Recommendation report
As earlier stated, MRP creates recommendation for purchase order and production order depending on whether the item in question is a purchase item or production item. Item X in our business scenario is a produced item, hence the order recommendation report for the business scenario will contain two lines of production orders as shown in Figure 12 and 13 below.
Figure 12
Figure 13 - Order Recommendation Report
The first line will be a recommendation for 30 quantities of item X while the second line will be for 10 quantities of item.
Reason
Line 1. Remember that we have 70 in stock for the gross requirement from the first forecast quantity (next 4 months) of 100.
Line 2. Remember that we designed a gross requirement of 8 quantities of item X from the second forecast (next 6 months). However, item X has a minimum order quantity of 10. Take note that the due dates picked by the system is calculated from the dates defined for the forecast.
The pegging Information
The pegging information in SAP Business One can be analyzed by checking the quantity displayed in either the receipt row or the gross requirement row of the MRP result window.
When the quantity for the receipt row is clicked, the source of the receipt is displayed. The source can be a purchase order or/and production order. The pegging information for gross requirement displays the source of the requirement, which can be open purchase orders, sales orders or forecasts.
The pegging information for the MRP result of our business scenario are shown in the figures below
Pegging information for receipt of 60 – 18.8.06 (see Figure 12) Note: I chose 2 Days interval
Figure 12
Pegging information for gross requirement of 30 – 19.9.06. (see Figure 13)
Figure 13
Colour Attributes
The MRP result has some “graphics sense”. Pale gray cells depicts periods where due date can not be met as a result of long lead-time. The values in these cells are displayed in red. Yellow cells depict periods in which receipt or gross requirement takes place.
Conclusion
Conclusively, there’s more to just running an MRP system. Been able to critically and objectively analyze the MRP is key to the success of an MRP system, especially when it is dependent on the ERP system – SAP Business One. This is because; the flaws in some definitions like lead-time, due date and even forecast, can impair on other modules like inventory, which can rubbish, not only the MRP system but also the ERP system.
posted by Kehinde Disu @ 6:29 PM
![]()
![]()


0 Comments:
Post a Comment
<< Home